With the transition from UWP to WinUI and from Xamarin iOS/Android to .NET for iOS and Android, we’re seeing the convergence of application development in the .NET ecosystem. This convergence shouldn’t be undervalued and is particularly evident when you realised that all of these once disparate platforms, can now take advantage of the common tooling provided by the dotnet team. In this post we’re going to look at dotnet-trace the performance analysis utility and how it can be used to profile an application by generating traces that can be opened in Visual Studio, PerfView or Speedscope.
Installing the Tools
To kick off we’re going to start by installing dotnet-trace and dotnet-router.
Dotnet-trace “enables the collection of .NET Core traces of a running process without a native profiler“
dotnet tool install -g dotnet-trace
Dotnet-dsrouter “enables diagnostic tools to communicate with a remote .NET runtime as if it has been running on the local machine“. This tool is only required when capturing traces from an application that isn’t running on the same machine where dotnet-trace is running, for example on an Android or iOS, device or emulator, or perhaps a Windows application running on a different computer.
dotnet tool install -g dotnet-dsrouter
Getting Started
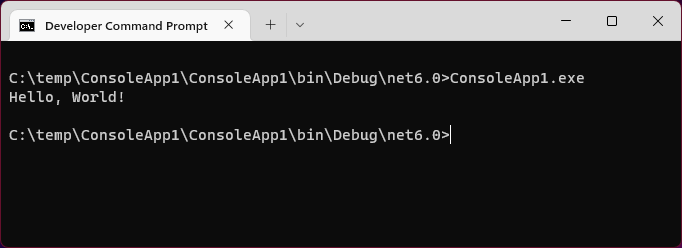
To begin with we’re going to trace a simple console application. In Visual Studio we’ll create a new application based on the Console App project template. This is essentially the simplest application we can make, consisting a single line of code, that, no surprises, outputs “Hello World!” to the console.

To run the application you can either press F5, or the play button, in Visual Studio, or, after you’ve built the application, you can run it from a command prompt.
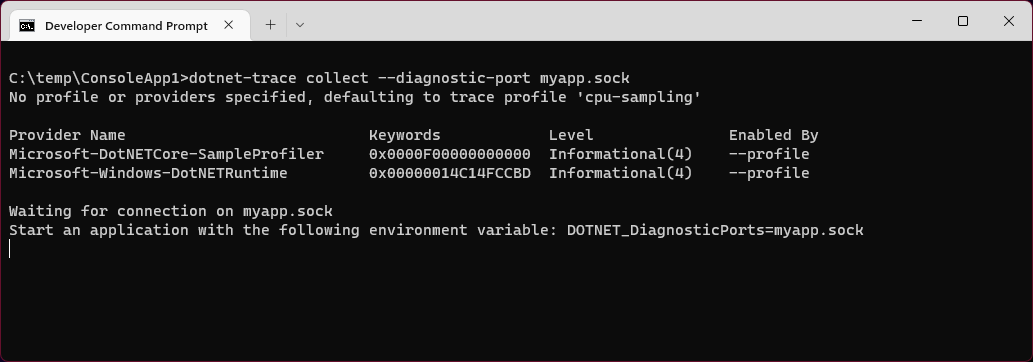
In order to capture a trace of this application we need to launch dotnet-trace. In this case we’re specifying the name of a socket to open in order to receive trace information.
dotnet-trace collect --diagnostic-port myapp.sock
After running dotnet-trace it’s important to note the last comment in the output as this indicates and important step in order to send trace information to dotnet-trace. The application needs to be launched with the environment variable DOTNET_DiagnosticPorts set to myapp.sock.
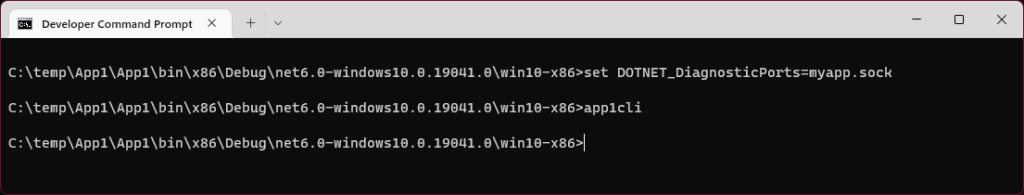
Setting the environment variable can be done a number of ways. If you’re launching the application from the command line you can simply use the “set” command (on Windows)
set DOTNET_DiagnosticPorts=myapp.sock
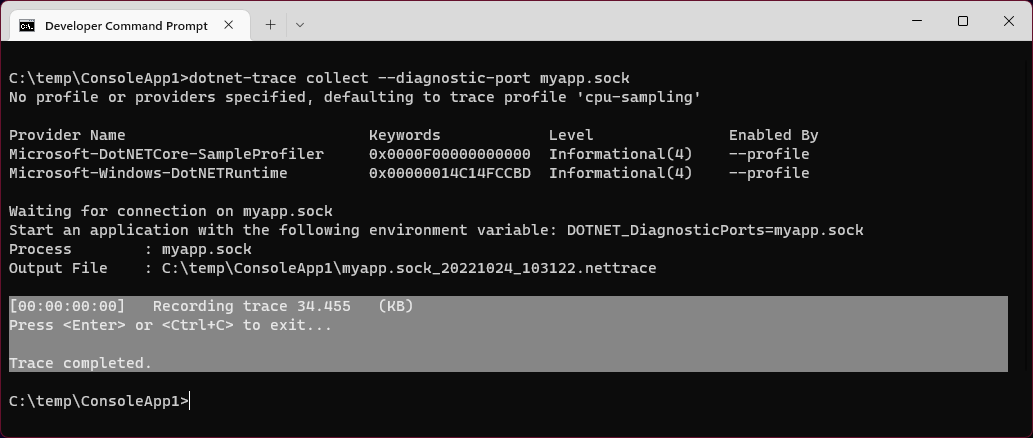
With the environment variable set, you can simply invoke the application. In our case by calling ConsoleApp1.exe. Since the console application will complete almost instantly, dotnet-trace will commence and then complete, indicating that a trace has been captured.
Alternatively, if you want to launch the application from Visual Studio, you can set the environment variable using the project properties page. Right-click on the project node in Solution Explorer and select properties
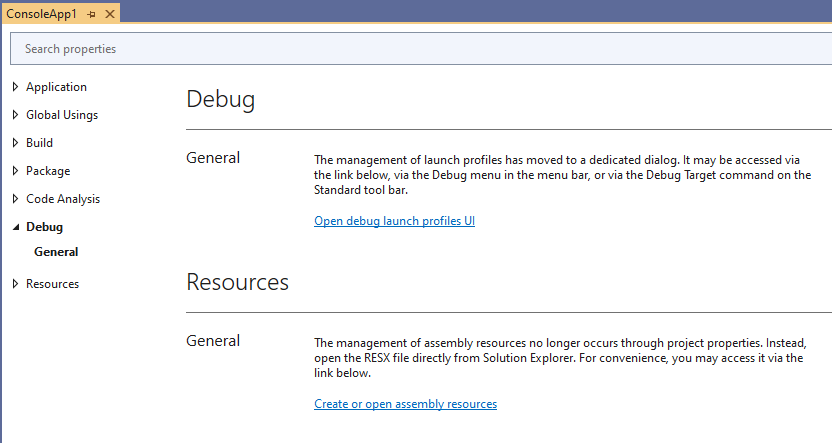
Open the Debug, General tab and then click on the Open debug launch profiles UI link.
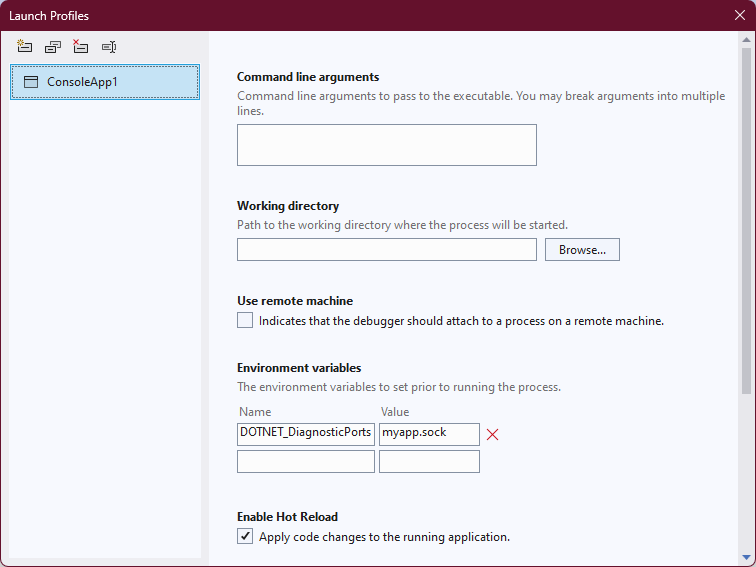
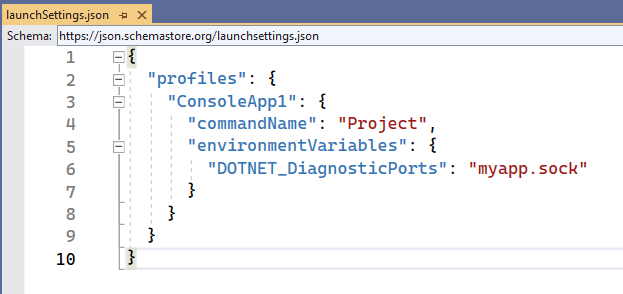
Scroll down to the Environment variables section and add a new name-value pair with Name set to DOTNET_DiagnosticPorts and value set to myapp.sock. When you close the profiles dialog, from Solution Explorer, under Properties there is a launchSettings.json file which specifies the environment variables to be set when the application is run from within Visual Studio.
Make sure you have dotnet-trace running (see above) and then run the application from Visual Studio.
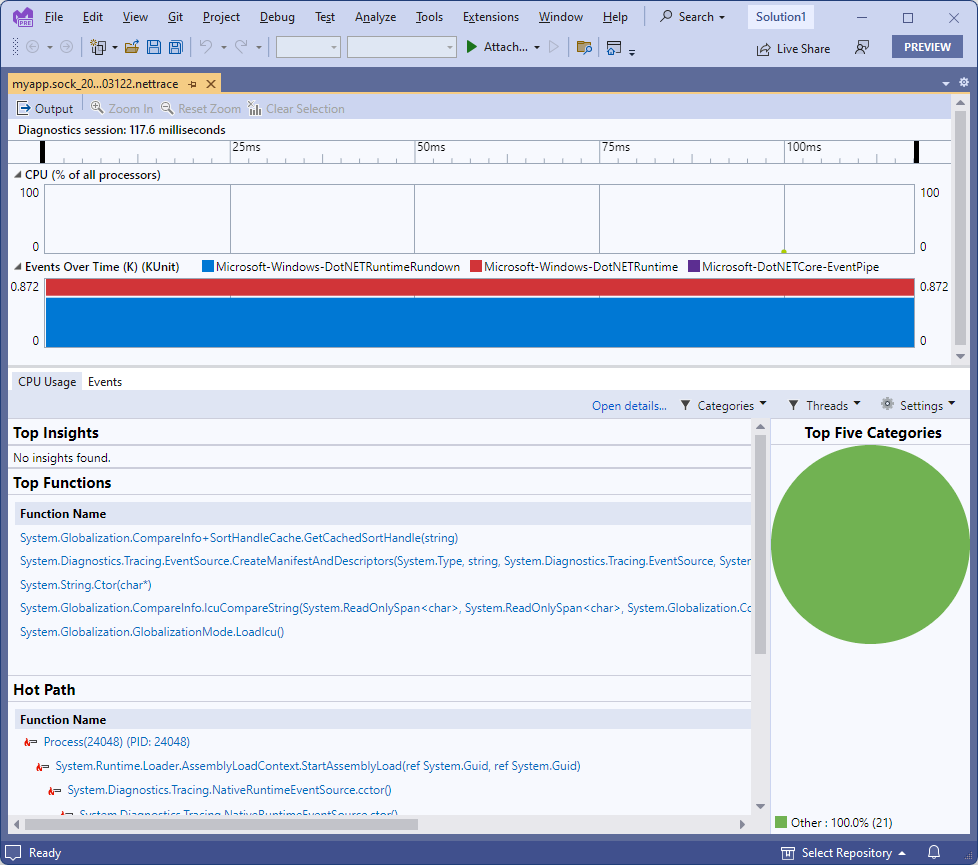
Trace Output
If you look in the folder where dotnet-trace was run, you should see a new nettrace file, in our case myapp.sock_20221024_103122.nettrace. The nettrace file and be opened directly in Visual Studio.
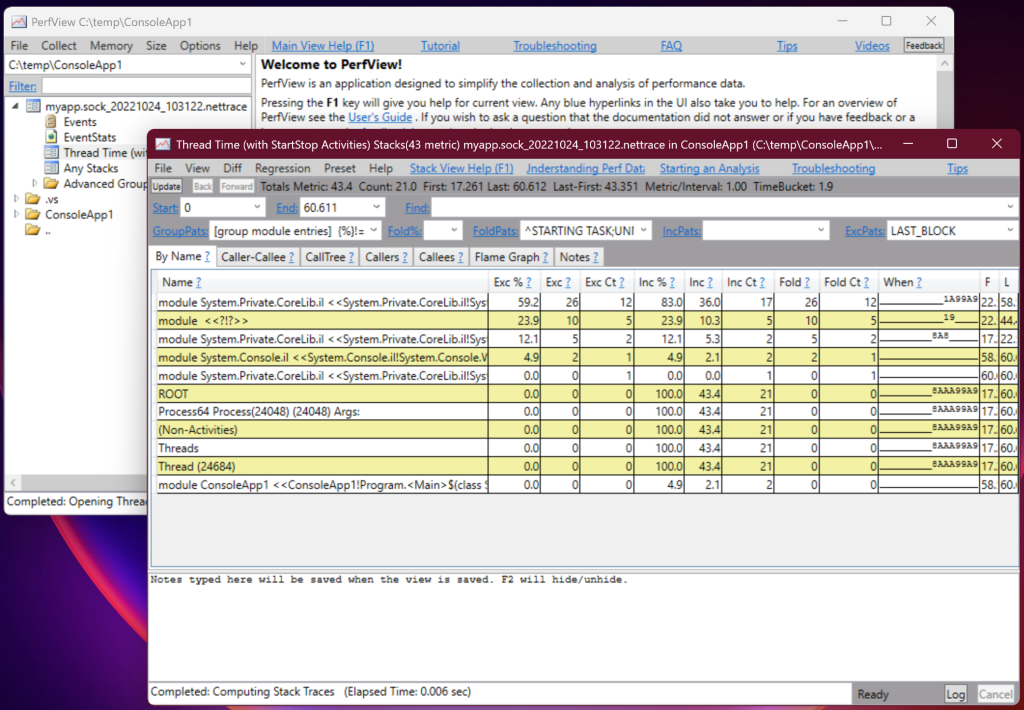
Alternative you can run PerfView and open the nettrace file (the UI of PerfView is a bit clumsy in that you need to set the folder where the nettrace file is located and then select the nettrace file in the folder view).
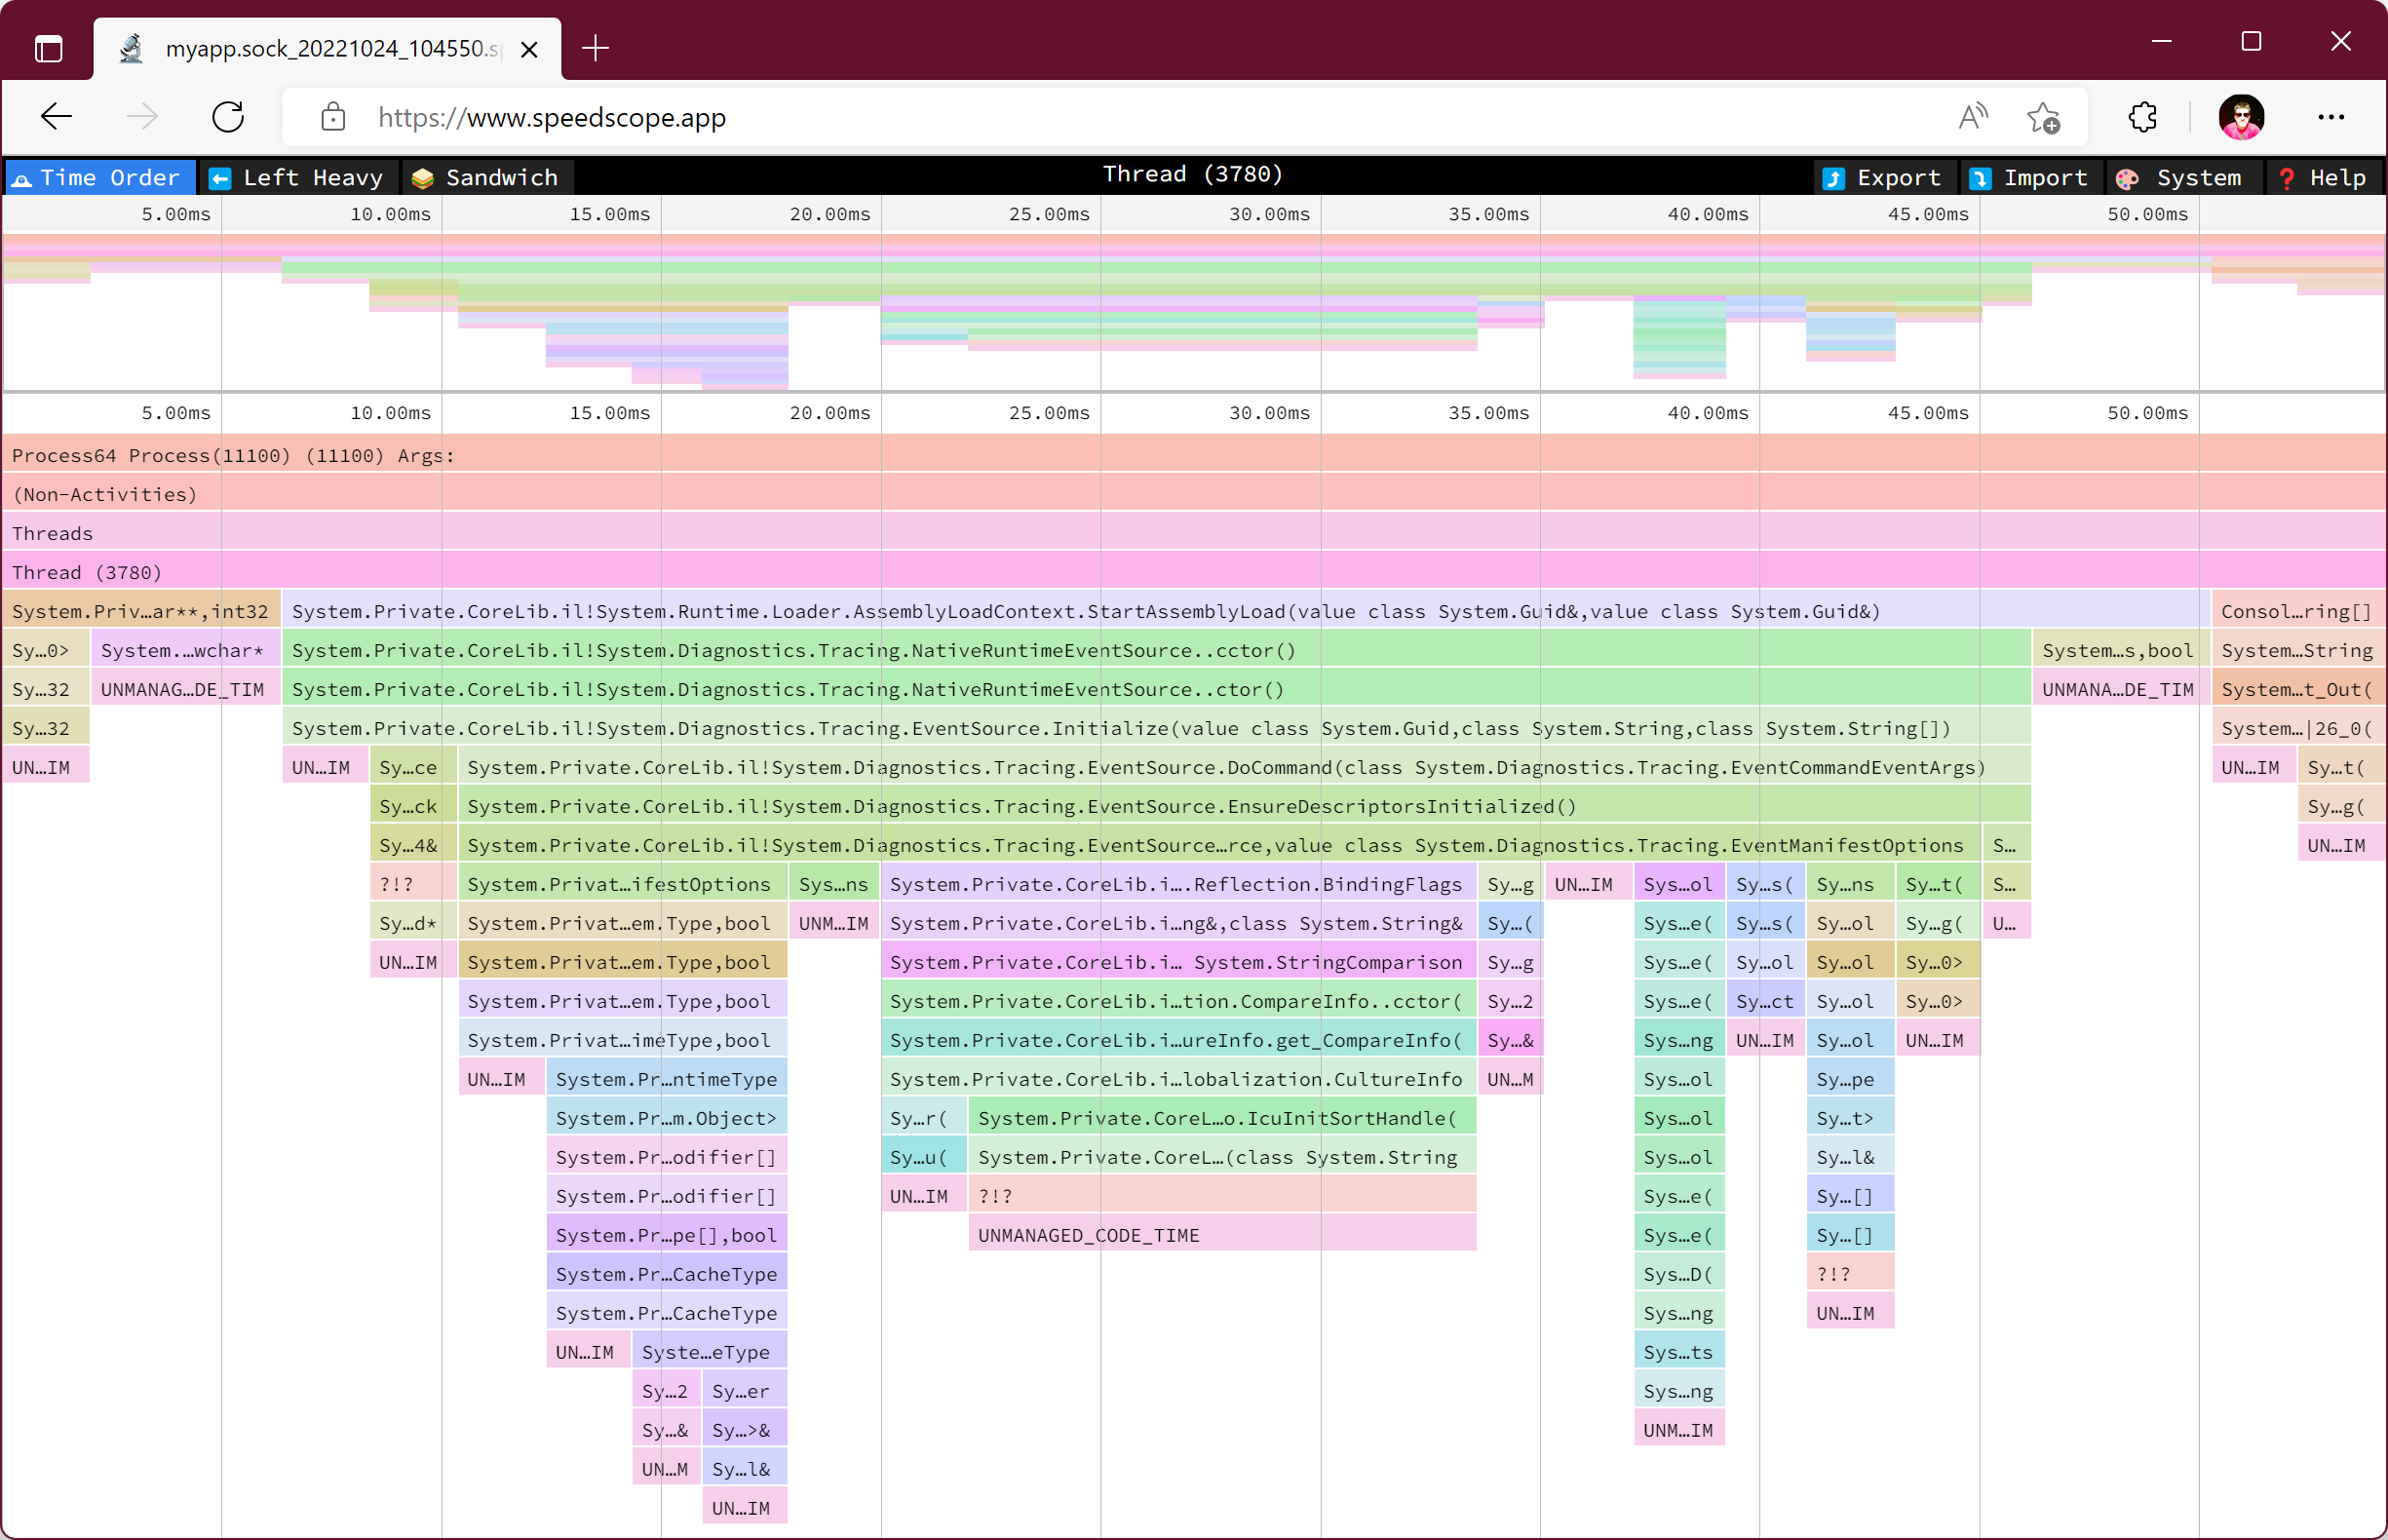
The third option for viewing the trace data is to use speedscope. To use this you either need to convert the nettrace file, or you can simply capture the trace data in the speedscope format.
dotnet-trace collect --diagnostic-port myapp.sock --format speedscope
The captured trace information will now be written to a speedscope json file eg myapp.sock_20221024_104550.speedscope.json, which can be opened in speedscope.
Profiling a Windows UI (Windows App SDK) Application
In order to profile a Windows App SDK application, or in fact any Windows application built using .NET 5 onwards, all you need to do is set the environment variable and then launch the application from the same context where the environment variable is set. This might sound a little cyptic but the point is that you can’t simply set the environment variable in a command prompt and then launch the application from the start menu (or from Visual Studio). Here are two options for tracing a WinUI/WinAppSdk application.
The first option is to set the environment variable in the launchSettings.json file. However, this will only work for unpackaged applications.
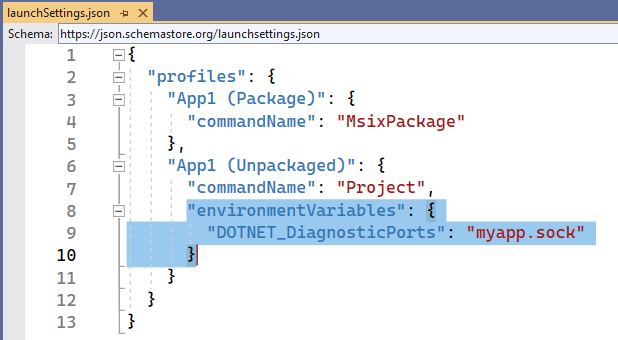
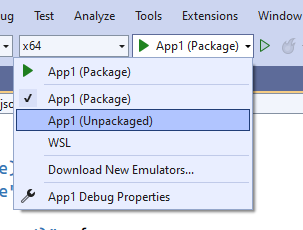
Once the environmentVariables node has been added, you can switch debug options in Visual Studio to the unpackaged option and then launch the application.
The second option is to set the environment variable in a command prompt and then launch the application manually from the command prompt. However, in order to do this, you’ll need to give the application an alias in the package.appxmanifest.
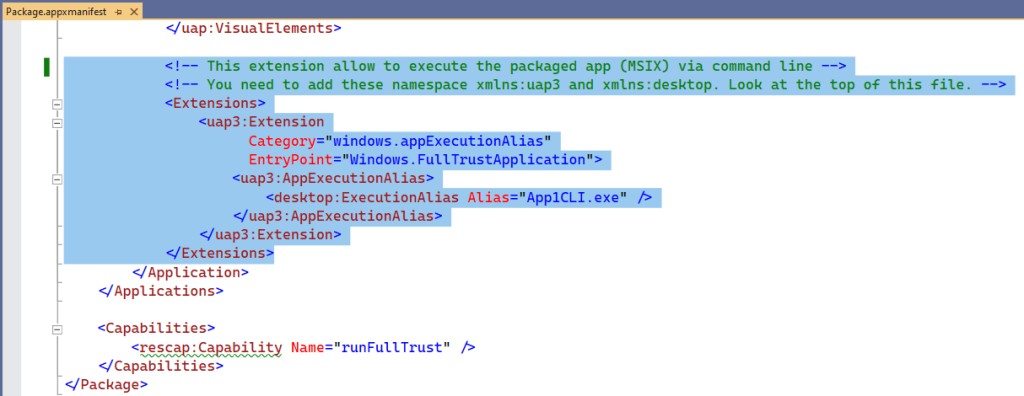
The XML to add is the Extensions element, and you’ll need to add the uap3 and desktop namespaces if you don’t already have them.
<?xml version="1.0" encoding="utf-8"?>
<Package
  xmlns="http://schemas.microsoft.com/appx/manifest/foundation/windows10"
  xmlns:uap="http://schemas.microsoft.com/appx/manifest/uap/windows10"
  xmlns:rescap="http://schemas.microsoft.com/appx/manifest/foundation/windows10/restrictedcapabilities"
    xmlns:uap3="http://schemas.microsoft.com/appx/manifest/uap/windows10/3"
  xmlns:desktop="http://schemas.microsoft.com/appx/manifest/desktop/windows10"
  IgnorableNamespaces="uap rescap">
     .......
	<!-- This extension allow to execute the packaged app (MSIX) via command line -->
	<!-- You need to add these namespace xmlns:uap3 and xmlns:desktop. Look at the top of this file. -->
	<Extensions>
		<uap3:Extension
				Category="windows.appExecutionAlias"
				EntryPoint="Windows.FullTrustApplication">
			<uap3:AppExecutionAlias>
				<desktop:ExecutionAlias Alias="App1CLI.exe" />
			</uap3:AppExecutionAlias>
		</uap3:Extension>
	</Extensions>
     .......
</Package>
The application can be launched using the Alias defined in the package.appxmanifest file, in this case App1Cli.exe.
Profiling Android and iOS Applications
Since both Android and iOS are now net6 based applications we can take advantage of the same capability to capture trace information about the application. However, there are two things we need to do.
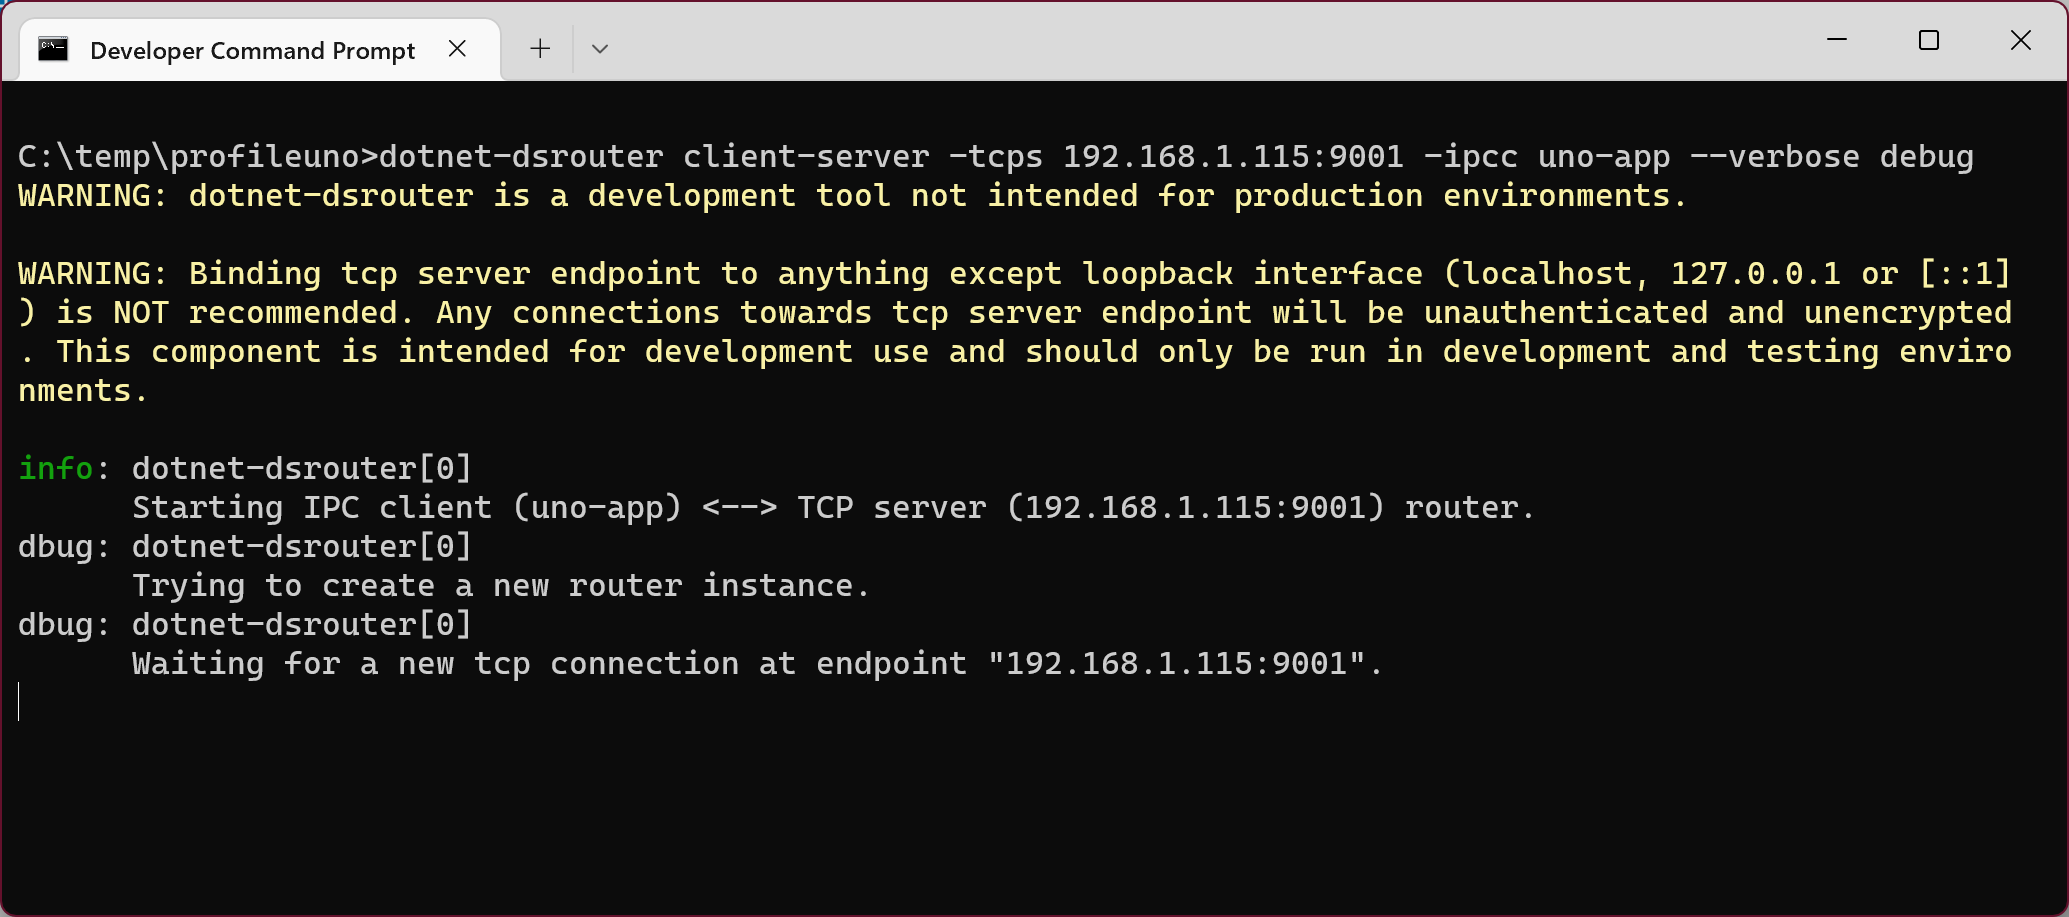
The first thing is that because the application won’t be running on the same machine as dotnet-trace, we have to setup dotnet-trace to receive trace data from a remote machine. For this, we use dotnet-dsrouter to route traffic from an external port to dotnet-trace. In this example we’re setting up port 9001 and because we want it to be accessible from a remote machine, we’re using an externally resolvable (on my local network) IP address, 192.168.1.115.
dotnet-dsrouter client-server -tcps 192.168.1.115:9001 -ipcc uno-app --verbose debug
Note: By default this port is most likely blocked by whatever firewall you’re using on your computer. You can temporarily open up the required port on your firewall to allow external traffic to be routed to dotnet-trace.
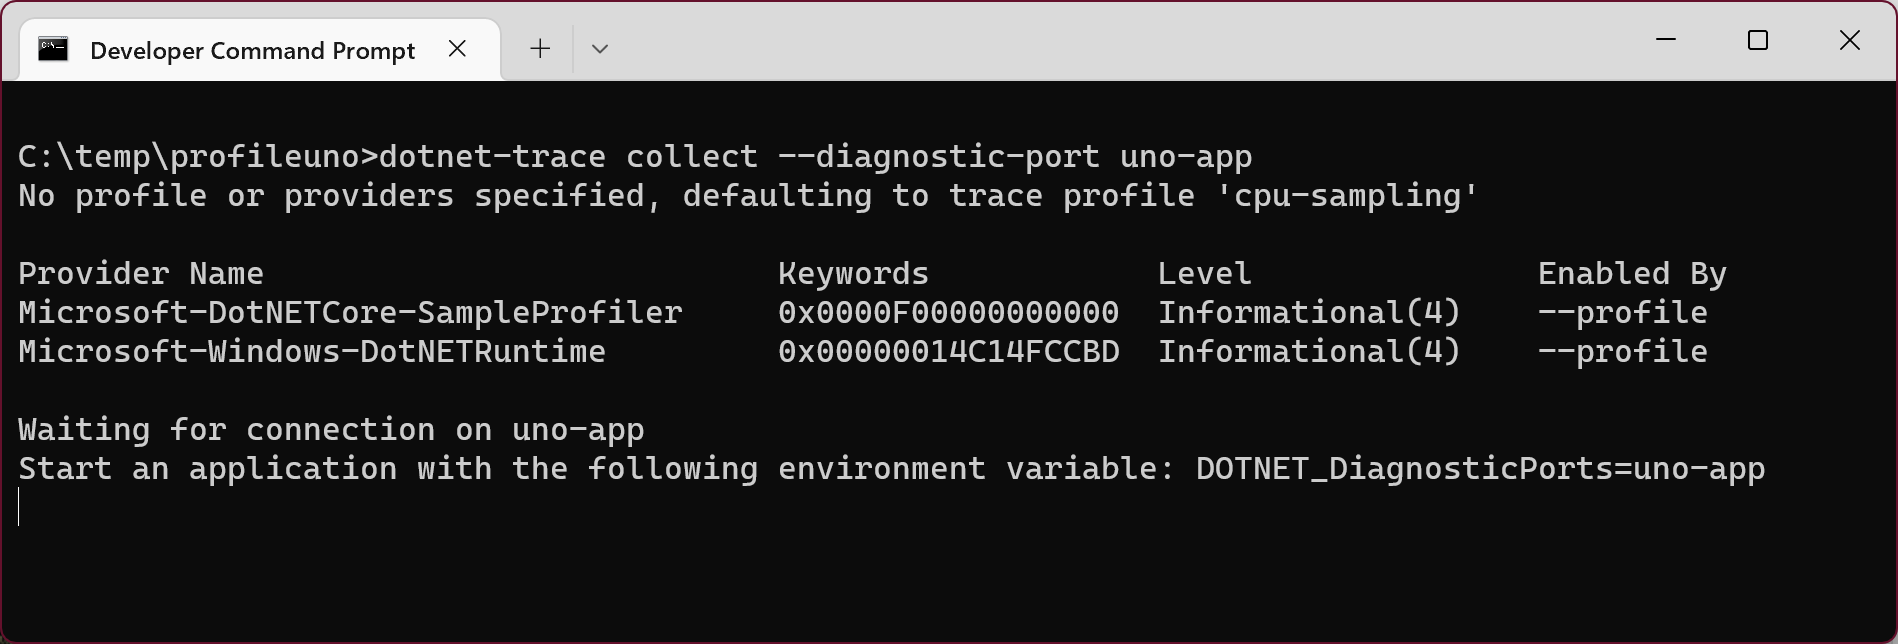
Next we need to start dotnet-trace, this time using the address of “uno-app” which correlates to the ipcc value from the dotnet-dsrouter command.
dotnet-trace collect --diagnostic-port uno-app
The second thing we need to do is to set the environment variable for our application. Since the applications aren’t launched from a command prompt, we can’t simply set the environment variable like we have done for profiling a console or Windows application. Instead we need to make sure the environment variable is included in the build process for each application type.
Setting Environment Variable for Android Application
Environment variables for an Android application can be set in a text file and packaged with the application. Create a text file, environment.txt, with the following contents:
DOTNET_DiagnosticPorts=192.168.1.115:9001
The environment.txt file should be referenced in the csproj file using an AndroidEnvironment element, within an ItemGroup.
<ItemGroup>
    <AndroidEnvironment Include="Android/environment.txt" />
</ItemGroup>
If you’re working with a csproj file with multiple targetframeworks, you may need to add a condition to the ItemGroup so it’s only included for Android eg.
<ItemGroup Condition="'$(TargetFramework)'=='net6.0-android'">
    <AndroidEnvironment Include="Android/environment.txt" />
</ItemGroup>
In addition to specifying the environment variable, the AndroidEnableProfiler property needs to be set to true.
<PropertyGroup Condition="'$(TargetFramework)'=='net6.0-android'">
    <AndroidEnableProfiler>true</AndroidEnableProfiler>
</PropertyGroup>
Lastly, for Android you need to set the RuntimeIdentifier to android-x64. Running on a 32bit device or emulator will generate unusable trace data, so is not supported.
<PropertyGroup Condition="'$(TargetFramework)'=='net6.0-android'">
    <RuntimeIdentifier>android-x64</RuntimeIdentifier>
</PropertyGroup>
Setting Environment Variable for iOS Application
Environment variables for iOS can be set using the MtouchExtraArgs property with the setenv argument.
<PropertyGroup Condition="'$(TargetFramework)'=='net6.0-ios'">
    <MtouchExtraArgs>$(MtouchExtraArgs) --setenv=DOTNET_DiagnosticPorts=192.168.1.115:9001</MtouchExtraArgs>
</PropertyGroup>
With the environment variable set for iOS and/or Android, the application can be run on any device /emulator/simulator that’s on the same network as the machine running dotnet-trace.
Thank you for detailed explanation.
I followed the steps mention above, my trace automatically stops when application launches in android emulator. Emulator is in same network as .net trace command. Could you please give me some hints where it is going wrong.
As far as I know the limitation I mentioned in the post still exists, which limits tracing to an actual device